tools-Jmeter
Jmeter
api和网站压力测试的工具,支持gui和terminal两种方式
mac 安装
下载jmeter binary version from http://jmeter.apache.org/download_jmeter.cgi click bin/ApacheJMeter.jar 启动 jmeter的gui界面
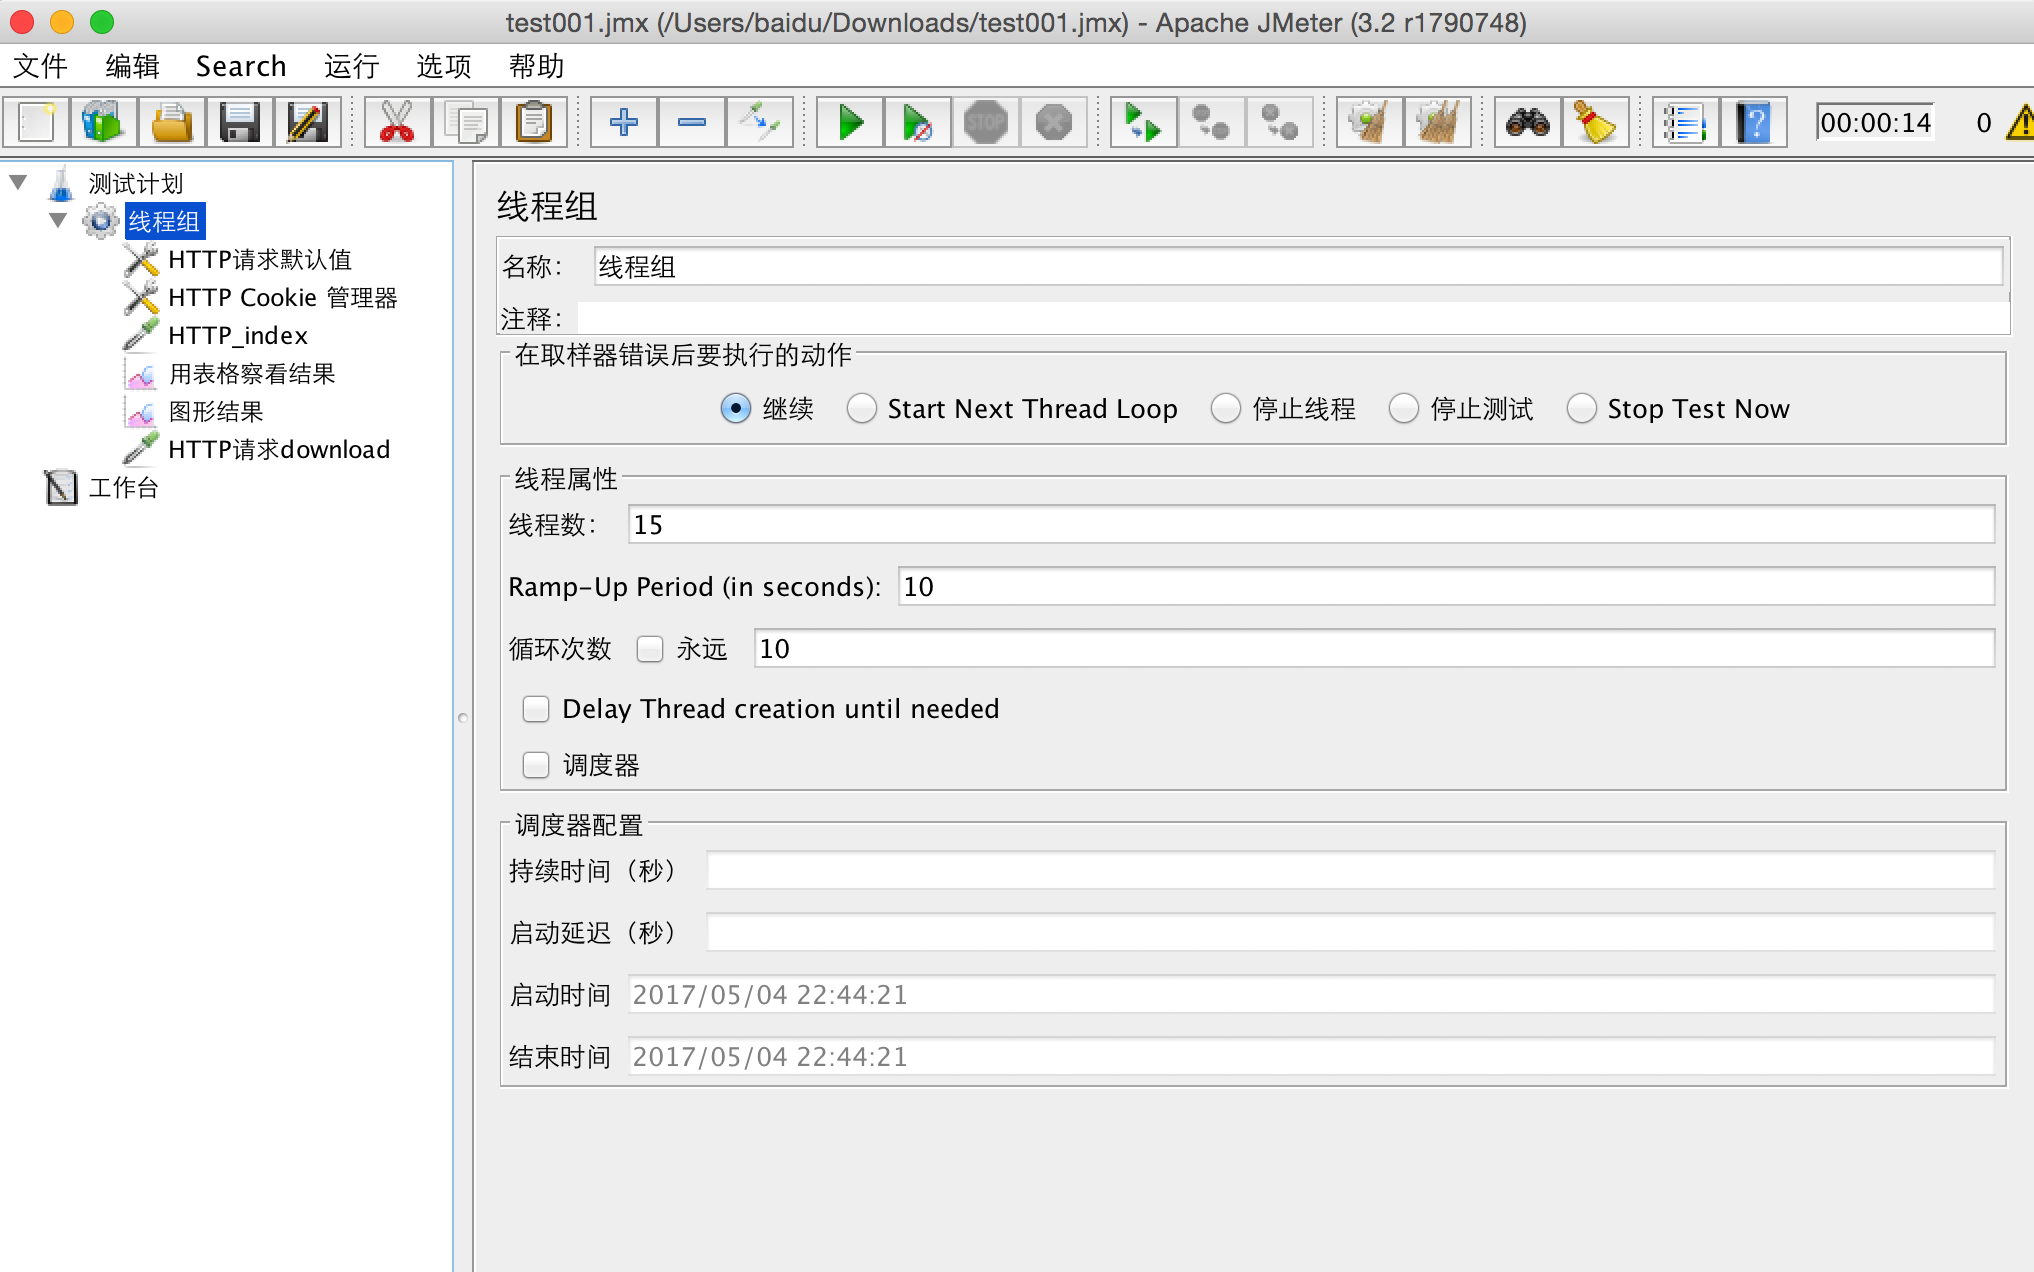
新建test plan
在线程组下面分别新建http请求默认值、http cookie管理器、http请求、用图表查看结果、用图形查 看结果,具体参考:http://jmeter.apache.org/usermanual/build-web-test-plan.html
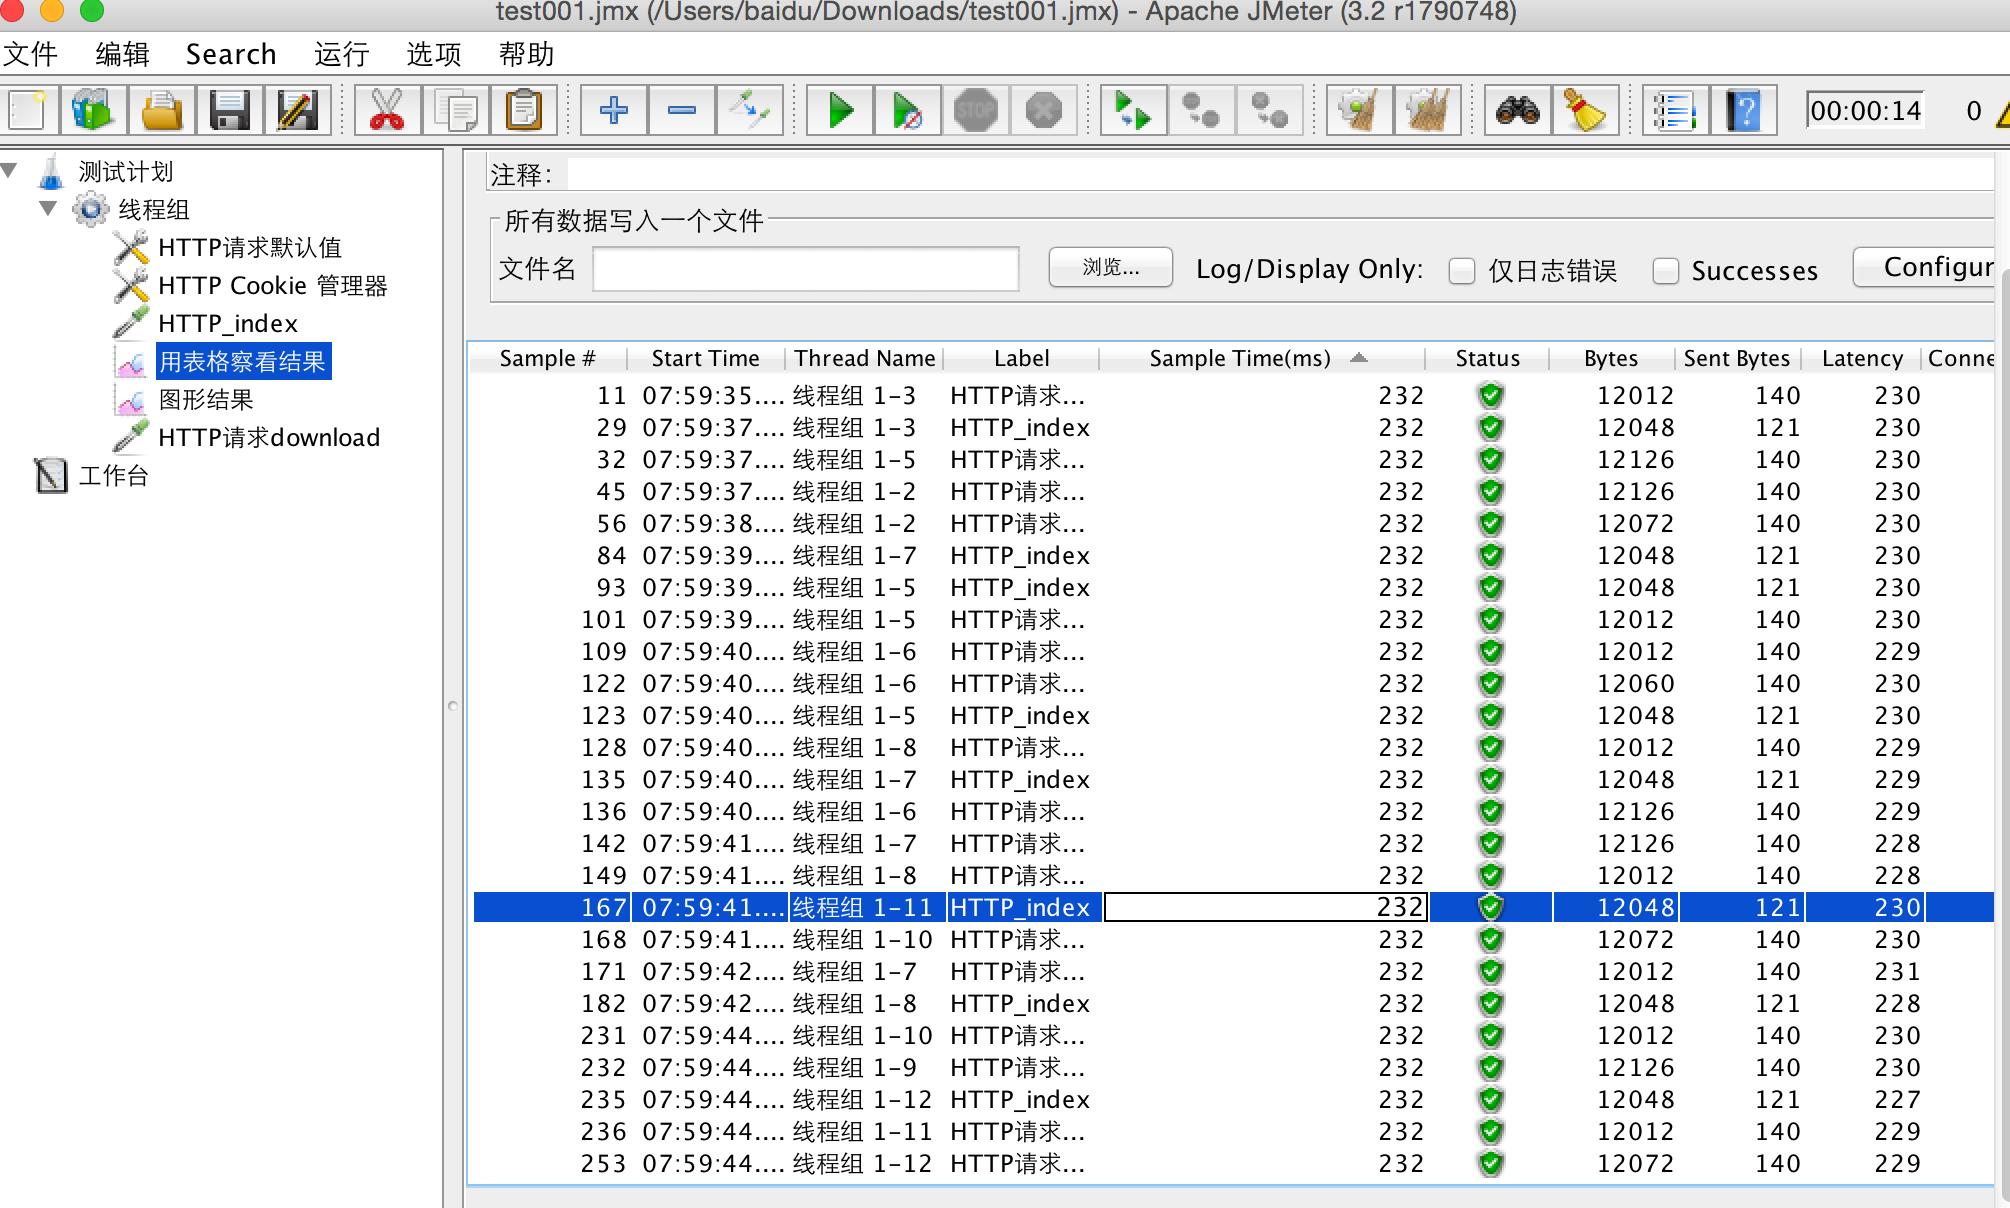
result info
Sample time is the number of milliseconds in which the server served the complete request.
 Status is the status of the request. It can be either a success, warning, or error.
 Bytes is the number of bytes received for the request.
 Latency is the number of milliseconds in which JMeter received the initial response from the server
sample time 和 Latency
Latency is a difference between time when request was sent and time when response has started to be received. Response time (= Sample time = Load time = Elapsed time) is a difference between time when request was sent and time when response has been fully received. So Response time always >= latency.
jmeter demo
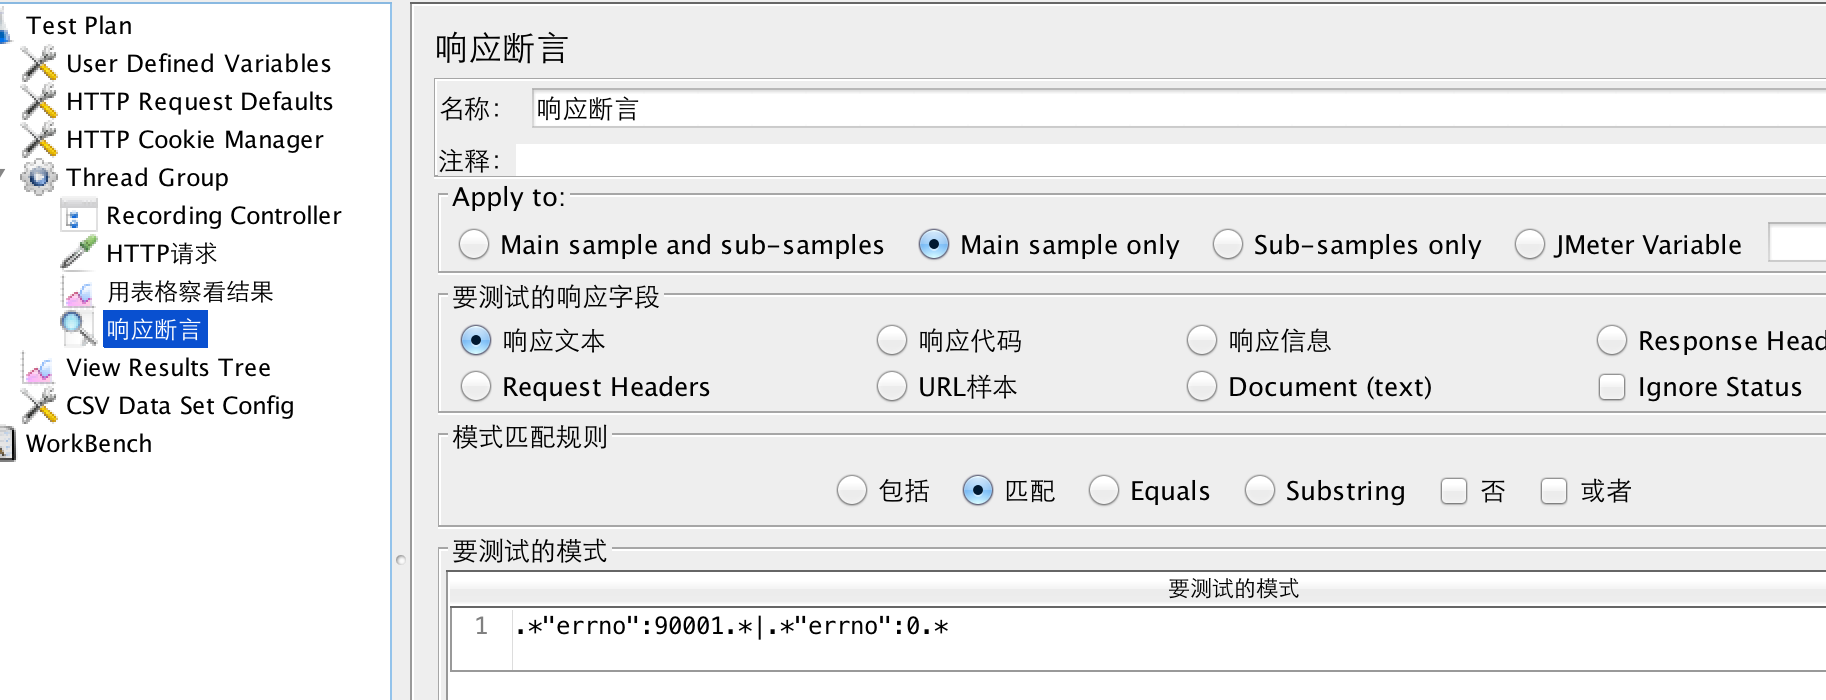
断言
正则表达式匹配比较常用,多个用 | 分割,表示或关系